Welcome back to the Kubernetes Homelab Series! 🚀
In the previous post, we set up persistent storage with Longhorn and MinIO. Today, we’re enhancing our cluster with a full monitoring and observability stack using Prometheus, Grafana, and AlertManager. We’ll also use a GitOps approach with ArgoCD to deploy and manage these tools.
Monitoring is critical in any Kubernetes environment, whether in production or in your homelab. A robust monitoring stack gives you real-time insights into resource consumption, application performance, and potential failures. By the end of this guide, you’ll have a fully functional monitoring stack that will help you answer questions like:
- How much CPU and memory are my applications consuming?
- Are my nodes and workloads operating correctly?
- Is my storage nearing its capacity limits?
- Are there any anomalies that could impact performance?
Kubernetes Upgrade: I’ve expanded my cluster with two additional worker nodes as VMs, bringing the total to four nodes. With plans to deploy more applications and services, this upgrade was essential to ensure scalability and performance.
The Monitoring Stack at a Glance
The stack we’ll deploy includes:
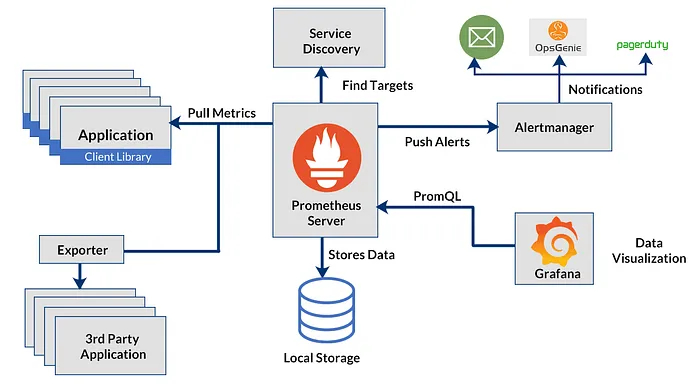
- Prometheus — Collects and stores metrics from Kubernetes and your applications.
- Grafana — Visualizes those metrics on customizable dashboards.
- AlertManager — Sends notifications when metrics breach defined thresholds.
- Node Exporter & Other Exporters — Pre-configured exporters to gather node and pod-level metrics.
Step 1: Deploy Prometheus and Grafana
Assuming you already have ArgoCD installed (refer to Part 2 for details), we’ll use the kube-prometheus-stack Helm chart.
Add the Helm Chart
helm repo add prometheus-community https://prometheus-community.github.io/helm-charts
helm repo update
Download the kube-prometheus-stack chart for customization:
helm fetch prometheus-community/kube-prometheus-stack --untarThis downloads the chart locally so you can modify the values as needed.
Step 2: Customize the Monitoring Stack
We need to configure persistent storage (using Longhorn) for Prometheus and Grafana and set up our alerting rules.
Create a custom-values.yaml file with the following content:
crds:
  create: false

grafana:
  service:
    type: LoadBalancer
    port: 80
  persistence:
    enabled: true
    accessModes:
      - ReadWriteOnce
    size: 8Gi
  affinity:
    nodeAffinity:
      requiredDuringSchedulingIgnoredDuringExecution:
        nodeSelectorTerms:
          - matchExpressions:
              - key: kubernetes.io/hostname
                operator: In
                values:
                  - beelink
prometheus:
  prometheusSpec:
    remoteWriteDashboards: false
    affinity:
      nodeAffinity:
        requiredDuringSchedulingIgnoredDuringExecution:
          nodeSelectorTerms:
            - matchExpressions:
                - key: kubernetes.io/hostname
                  operator: In
                  values:
                    - beelink
    serverSideApply: true
    retention: 12h
    storageSpec:
      volumeClaimTemplate:
        spec:
          storageClassName: longhorn
          accessModes:
            - ReadWriteOnce
          resources:
            requests:
              storage: 25Gi
    resources:
      requests:
        memory: 3Gi
        cpu: 500m
      limits:
        memory: 6Gi
        cpu: 2
This configuration ensures that both Prometheus and Grafana have persistent storage and are scheduled on your preferred node (the Beelink mini PC).
Step 3: Deploy the Stack with ArgoCD
We’ll now define an ArgoCD application to deploy the monitoring stack. Save the following manifest as monitoring-application.yaml:
apiVersion: argoproj.io/v1alpha1
kind: Application
metadata:
  name: monitoring
  namespace: argocd
spec:
  project: default
  sources:
    - repoURL: 'https://prometheus-community.github.io/helm-charts'
      chart: kube-prometheus-stack
      targetRevision: 67.9.0
      helm:
        valueFiles:
          - $values/apps/kube-prometheus-stack/custom-values.yaml
    - repoURL: 'https://github.com/pablodelarco/kubernetes-homelab'
      targetRevision: main
      ref: values
  destination:
    server: 'https://kubernetes.default.svc'
    namespace: monitoring
  syncPolicy:
    automated:
      prune: true
      selfHeal: true
    syncOptions:
      - CreateNamespace=true
This instructs ArgoCD to deploy the Prometheus stack using your customized values from your Git repository.
Step 4: Set Up Grafana Dashboards
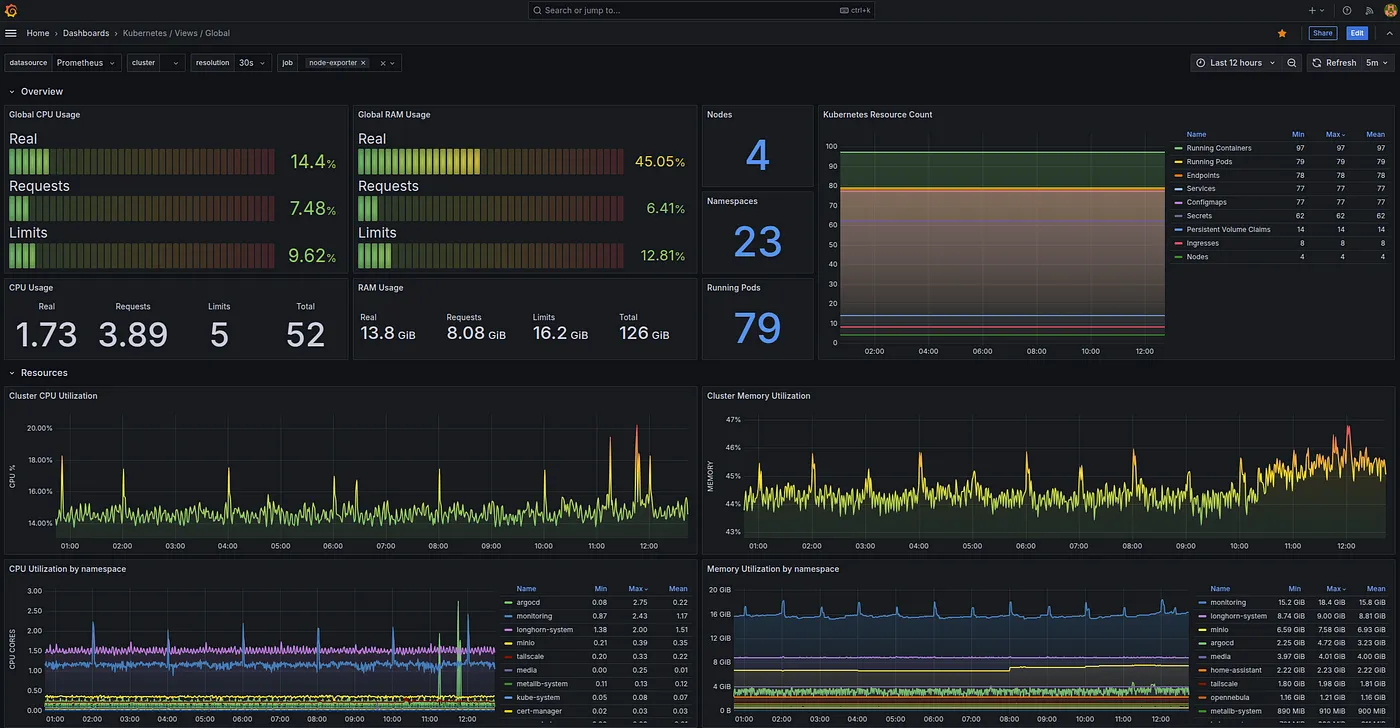
Grafana is the visualization layer. One of the key dashboards we’ll use is the Kubernetes Dashboard: 15757. This dashboard displays:
- Cluster Resource Usage: Displays CPU and RAM usage (real, requested, and limits) across the cluster.
- Kubernetes Objects Overview: The number of nodes, namespaces, running pods, and other resources.
- Performance Metrics: Tracks CPU and memory utilization trends over time.
- Namespace Breakdown: Visualizes CPU and memory usage per namespace.

Grafana Login Credentials
- Default username: admin
- Retrieve password:
kubectl get secret -n monitoring monitoring-grafana -o jsonpath="{.data.admin-password}" | base64 --decodeStep 5: Configuring AlertManager
Defining Alert Rules
To monitor critical cluster events, we’ll define Prometheus alert rules for:
- High CPU Usage (>80% for 2 minutes)
- High Memory Usage (>80% for 2 minutes)
- Node Down (Unreachable for 5 minutes)
- CrashLoopBackOff (Pod stuck for 5 minutes)
Create a file named alerts.yaml:
apiVersion: monitoring.coreos.com/v1
kind: PrometheusRule
metadata:
  name: cluster-alerts
  namespace: monitoring
spec:
  groups:
    - name: cluster-rules
      rules:
        - alert: HighCPUUsage
          expr: (1 - avg(rate(node_cpu_seconds_total{mode="idle"}[5m])) by (instance) > 0.8
          for: 2m
          labels:
            severity: critical
          annotations:
            summary: "High CPU usage on {{ $labels.instance }}"
            description: "CPU usage is {{ humanize $value }}% for 2 minutes."

        - alert: HighMemoryUsage
          expr: (1 - (node_memory_MemAvailable_bytes / node_memory_MemTotal_bytes)) > 0.8
          for: 2m
          labels:
            severity: critical
          annotations:
            summary: "High memory usage on {{ $labels.instance }}"
            description: "Memory usage is {{ humanize $value }}% for 2 minutes."

        - alert: NodeDown
          expr: up{job="node-exporter"} == 0
          for: 5m
          labels:
            severity: critical
          annotations:
            summary: "Node {{ $labels.instance }} is down"
            description: "Node has been unreachable for 5 minutes."

        - alert: CrashLoopBackOff
          expr: kube_pod_container_status_waiting_reason{reason="CrashLoopBackOff"} == 1
          for: 5m
          labels:
            severity: critical
          annotations:
            summary: "Pod {{ $labels.pod }} is crashing"
            description: "Pod {{ $labels.pod }} in {{ $labels.namespace }} is in CrashLoopBackOff."
Configuring AlertManager for Email Notifications
To receive alerts via email, define the AlertManager configuration in alertmanager-configmap.yaml:
apiVersion: v1
kind: ConfigMap
metadata:
  name: alertmanager-config
  namespace: monitoring
data:
  alertmanager.yml: |
    global:
      resolve_timeout: 5m
      smtp_smarthost: 'smtp.example.com:587'
      smtp_from: 'alertmanager@example.com'
      smtp_auth_username: 'alertmanager@example.com'
      smtp_auth_password: 'yourpassword'
      smtp_require_tls: true

    route:
      receiver: 'email-notifications'
      group_wait: 30s
      group_interval: 5m
      repeat_interval: 3h

    receivers:
    - name: 'email-notifications'
      email_configs:
      - to: 'your-email@example.com'
        send_resolved: true
Conclusion
With Prometheus, Grafana, and AlertManager fully integrated, your Kubernetes homelab now has a robust monitoring and alerting stack. This setup ensures real-time observability, allowing you to detect and respond to high resource usage, node failures, and pod crashes before they become critical.
Next, we’ll explore Kubernetes networking and ingress, focusing on how to simplify load balancing with MetalLB and enhance remote access using Tailscale. This will provide seamless connectivity and improved security for your homelab. Stay tuned!
If you’re building your own Kubernetes homelab, let’s connect on LinkedIn and exchange insights! You can also check out all my other posts on Medium.